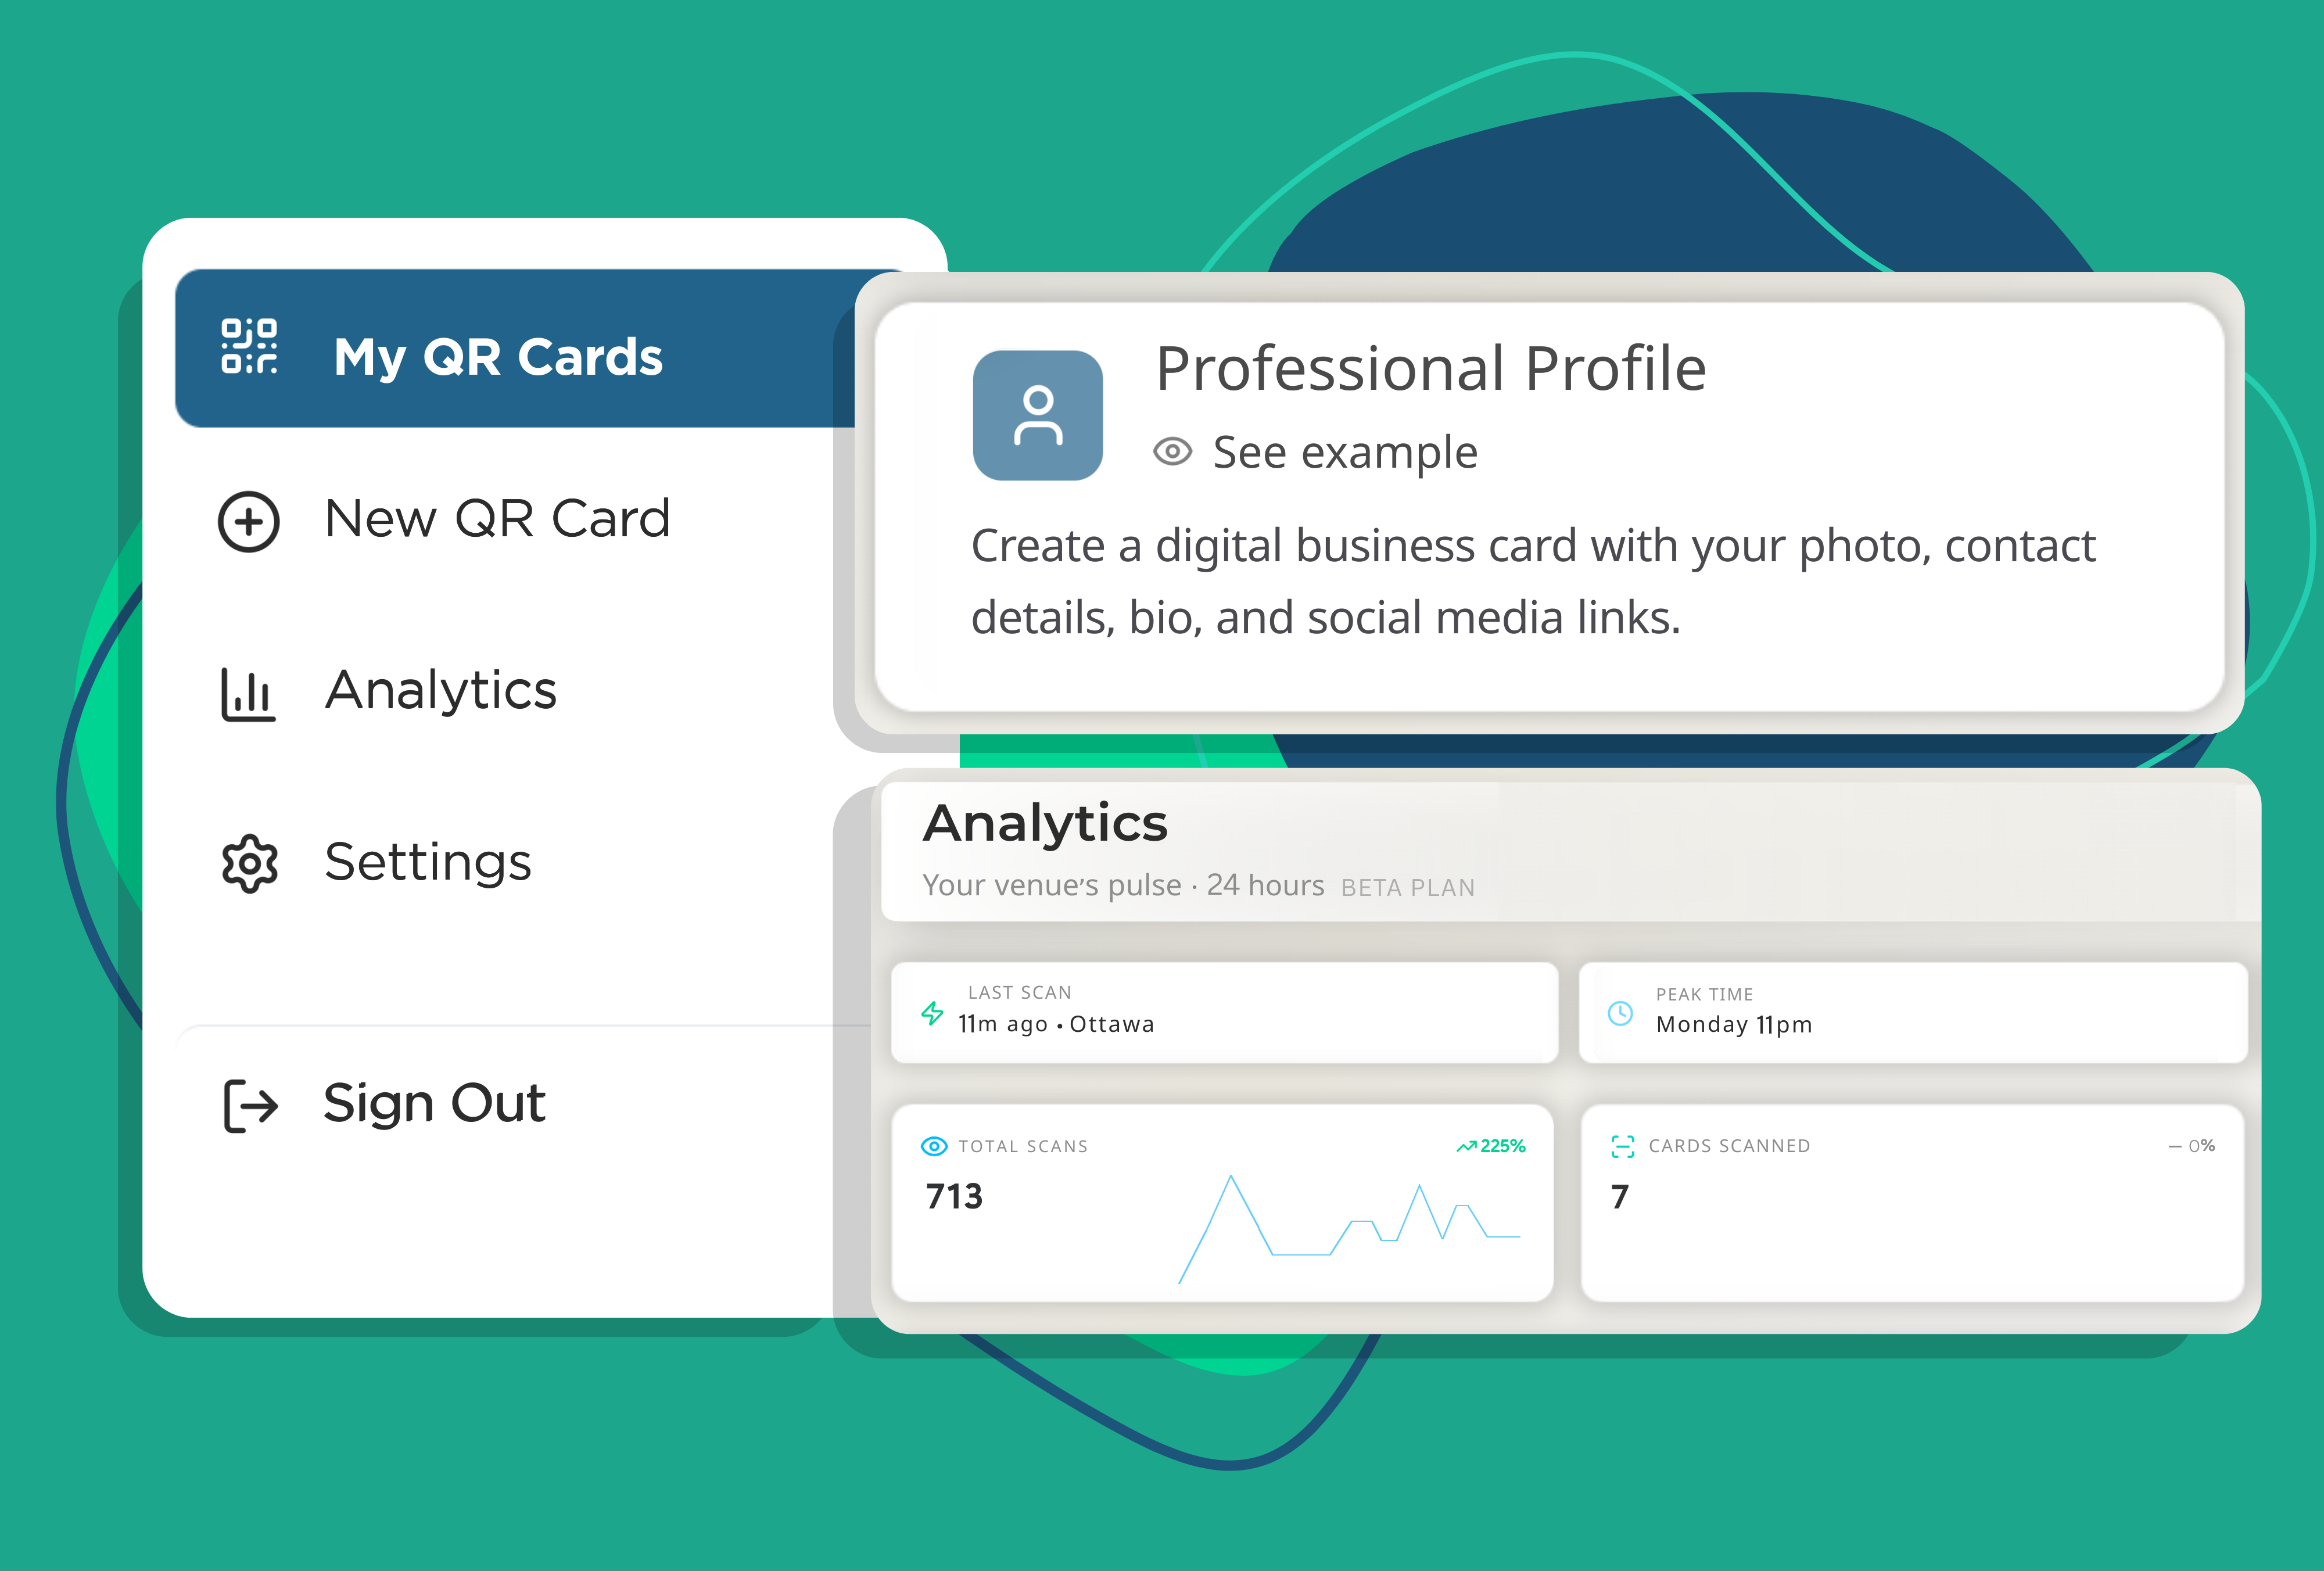


📍 Real-Time Snapshot
- Last Scan: Most recent interaction with city (when available)
- Peak Moment: Highest engagement window (e.g., Saturday at 8 PM)
- Quietest Period: Lowest activity timeframe
- Average Activity: Scans per day or hour
📊 Headline KPIs
- Total Scans: Overall engagement
- Cards Scanned: Unique cards receiving traffic
- Live Count: Today's or current hour activity
- Reach Growth: % change vs previous period
Includes subtle trend sparklines for quick insights
📈 Trends & Patterns
- Time-Series Analytics: Track scans over time with comparisons
- 7×24 Heatmap: Weekly engagement grid with peak highlights
- Smart Insights: "Your busiest hour is Friday at 7 PM."
🌟 Per-Card Spotlight
- Top Performer: Most scanned card
- Fastest Growing: Highest percentage increase
- Needs Attention: Underperforming cards
Each includes a mini sparkline of recent activity
🌍 Geographic Breakdown
- Countries: Flag-based list with scan share
- Cities: (Pro / Business) Urban engagement insights
- Regions: (Pro / Business) State/province breakdown
📱 Device Intelligence (Pro / Business)
- Platform Split: iOS, Android, Desktop
- Visual Breakdown: Donut chart of usage
- Device Signals: Interaction insights by device
⚡ Live Activity
- Recent Feed: Last 5 scans with card, location, device, time
- Live Indicator: ● Real-time activity
- Per-Card Table: Totals with trend sparklines